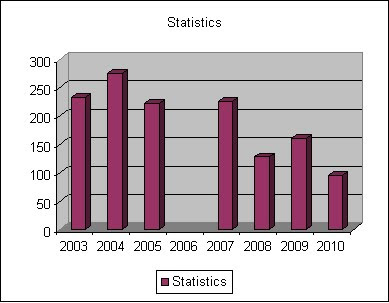
What I have here is a chart which represents the number of students in the school form the year 2003 to 2010. Making it was easy actually, I just had to click on Insert icon in Excel and then click on Chart, after the chart was introduced on the page I just had to edit it by right clicking on the mouse and then another click on Source Data and after that I had to edit the Name the Values and the Category (x) axis labels, that was all.....

hey man its is a nice explenation of how to make a chart in excel and all in just a few words.
RăspundețiȘtergerekeep it up DUDE